本章给出了一个完整的计算示例。 下面提供了必要的数据,目的是确定:
1. 参考作物蒸发量(数据表 3:ETo)
2. 各种作物的作物需水量(数据表 4:Kc 和 6:ET crop)
3. 各种作物的灌溉用水需求(数据表 6:IN)
一般数据
Location地点: | Example (2)见例2 |
Latitude纬度: | 8° North |
CROP DATA 作物数据
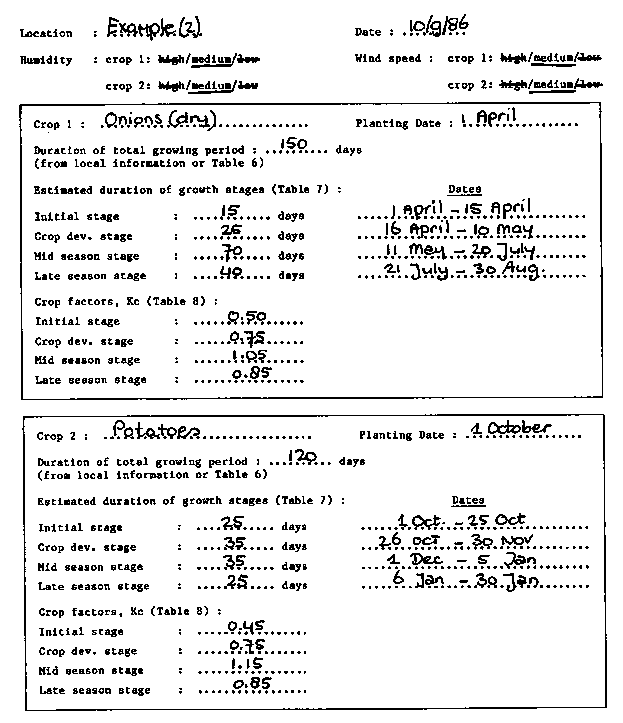
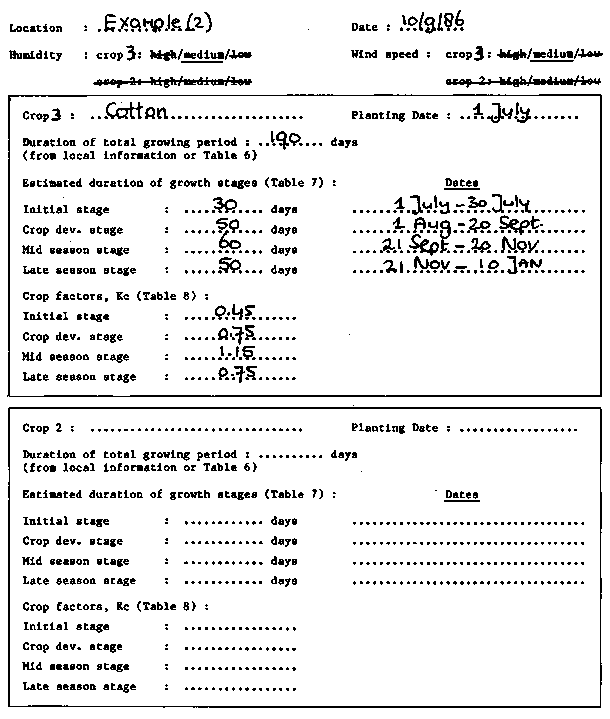
种植了三种作物:洋葱(旱地),紧随其后的是土豆和棉花。
Crop作物 | Planting date种植日期 | Total season growing 全生育期(days) |
Onions洋葱 (dry旱地) | 1 April四月1日 | 150 |
Potatoes | 1 Oct十月1日 | 120 |
Cotton | 1 July 七月1日 | 190 |
CLIMATIC DATA气候数据
Relative humidity相对湿度 (year round): | medium中等 |
Windspeed 风速(year round): | medium中等 |
| J | F | M | A | M | J | J | A | S | O | N | D |
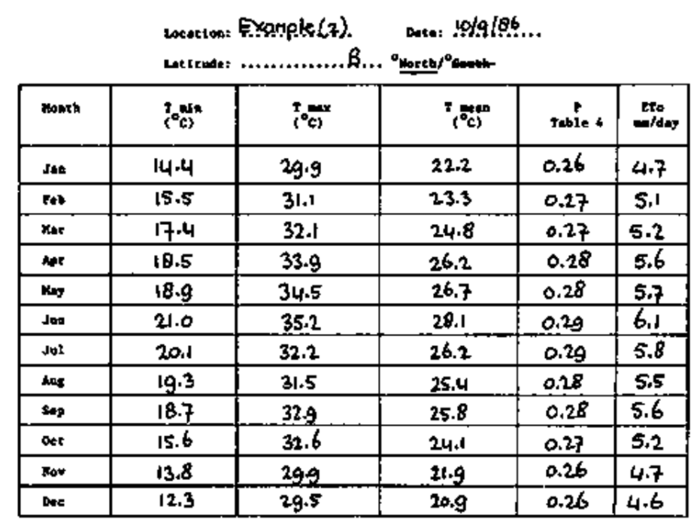
T min (°C) | 14.4 | 15.5 | 17.4 | 18.5 | 18.9 | 21.0 | 20.1 | 19.3 | 18.7 | 15.6 | 13.8 | 12.3 |
T max (°C) | 29.9 | 31.1 | 32.1 | 33.9 | 34.5 | 35.2 | 32.2 | 31.5 | 32.9 | 32.6 | 29.9 | 29.5 |
P (mm) | 19 | 21 | 28 | 33 | 37 | 38 | 121 | 134 | 44 | 28 | 19 | 5 |
Irrigating onions 灌溉洋葱
DATA SHEET 3 Determination ETo: Blaney-Criddle Method
数据表 3 测定 ETo:Blaney-Criddle 方法
DATA SHEET 4 Determination of crop factors
数据表 4 作物系数的测定
DATA SHEET 4 - No. 2 - Determination of crop factors
数据表 4 - 第 2 号 - 作物系数的测定
DATA SHEET 6 Determination of Irrigation water needs (see also Data sheet 5)
数据表 6 确定灌溉用水需求(另见数据表 5)
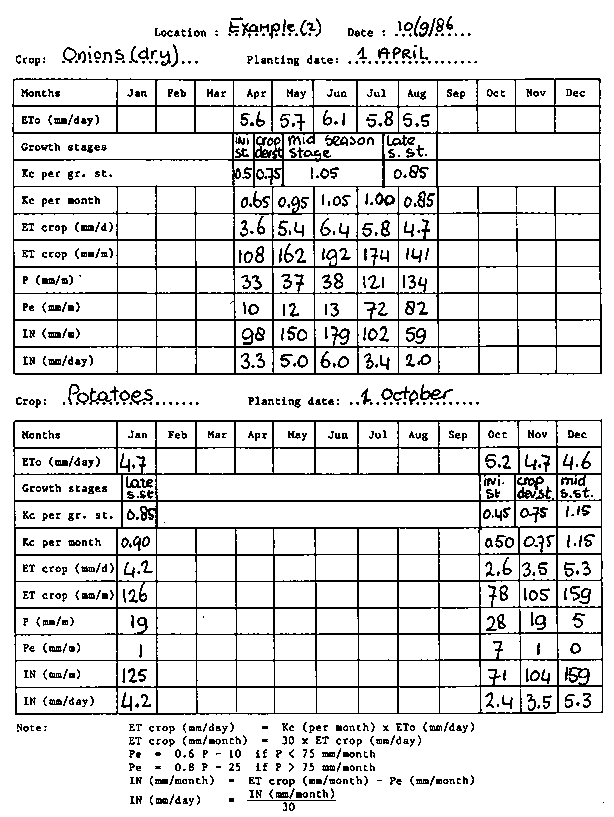
DATA SHEET 6 Determination of Irrigation water needs No. 2 (see also Data sheet 5)
数据表 6 确定第 2 号灌溉水需求